
English 
T: +86-571-8663-6649
E: hzbjys@hzbjys.com
E: hzbjys@hzbjys.com
7/F, 1st Building Of ZhongHao WangJiang International Center, NO.332 East WangJiang Road, HangZhou, ZheJiang, China.
Views: 0 Author: Site Editor Publish Time: 2026-10-30 Origin: Site


How much is copper per pound right now? On November 3, 2026, COMEX trades at $6.38 per pound, according to Devere Group. That figure gives you a useful benchmark. Your real cost still depends on grade, order size, and the market you buy from.
Copper prices shift with supply and demand and with global events. The copper market reacts to news quickly. When you ask how much is copper per pound for a specific grade, the copper price can land well above or below the headline number.
A sourcing partner such as Hangzhou Target Import & Export Co., Ltd. (HZTG) supplies graded sheets, strips, busbars, and foil.
The exchange price is just a starting point. What you actually pay for copper depends on grade, order size, and the market.
Supply and demand control copper prices. Keep an eye on construction, technology, and mine output.
China's buying power can change copper prices fast. Pay attention to Chinese policy and scrap rules.
Projects that shift the world to cleaner energy raise the need for copper. Electric vehicles and power grids use a lot of copper.
Look at copper prices over several days. Compare grades to understand market trends.
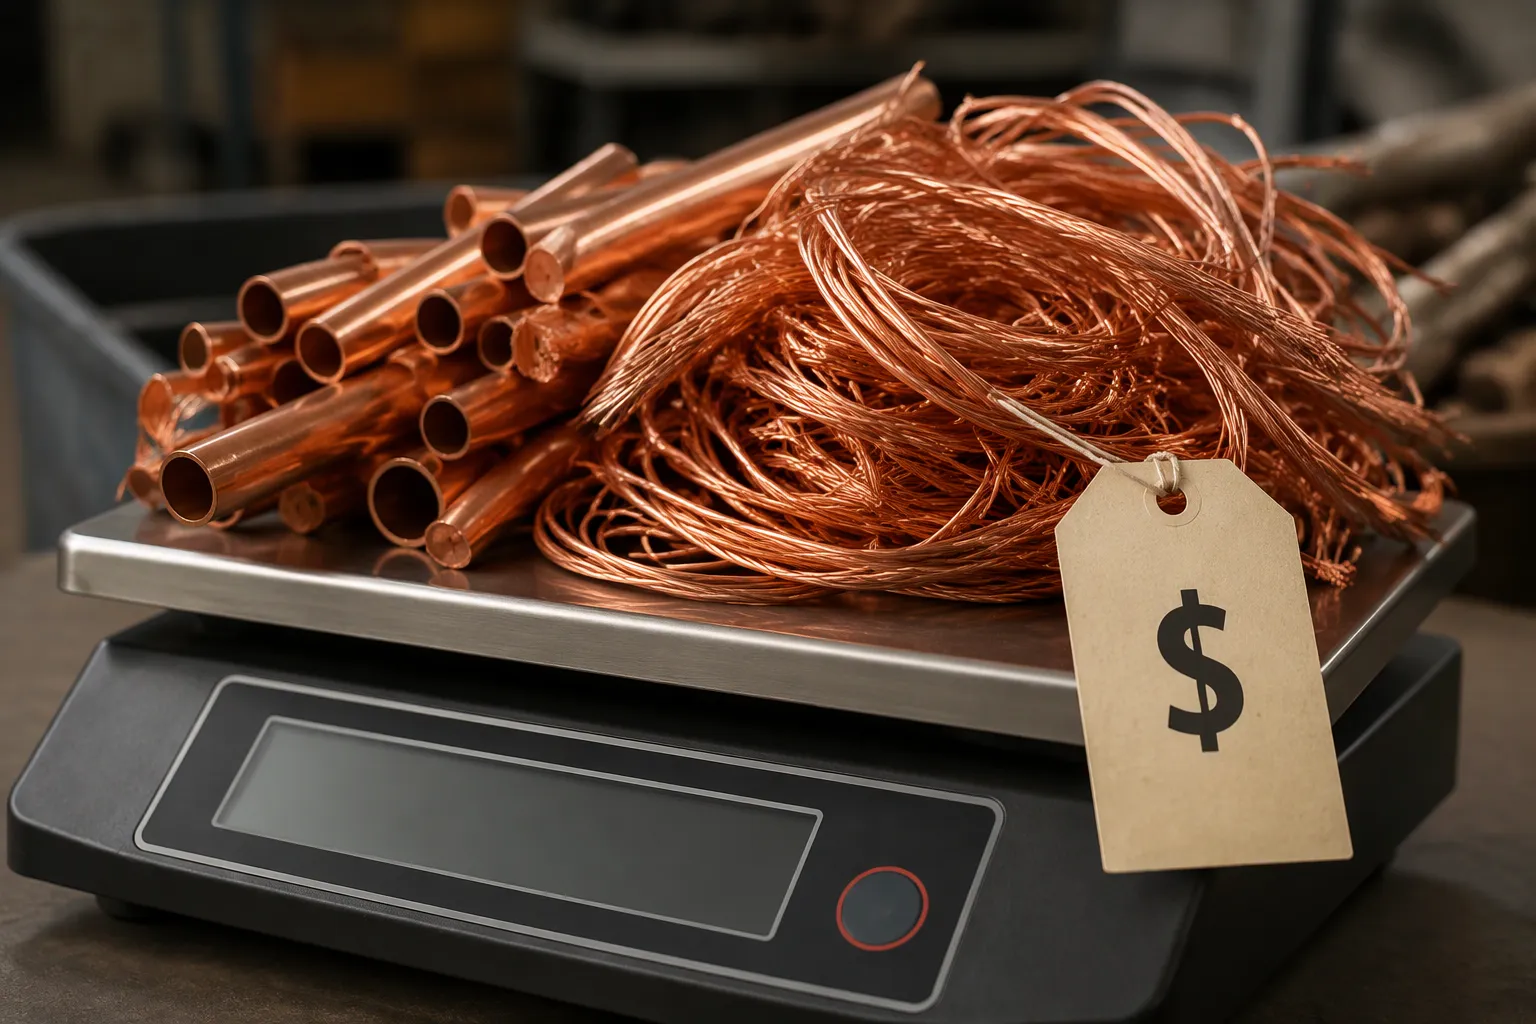
You can check the benchmark any morning, but treat it as a snapshot. As of November 4, 2026, COMEX copper sits at $6.42 per pound, according to metalcharts.org. That number answers how much is copper per pound for refined metal on an exchange. It does not set the rate you pay for a specific grade or form.
The spot price tracks the soonest-expiring futures contracts on exchanges such as COMEX and the London Metal Exchange. Traders price immediate delivery against global supply and demand signals, so the figure moves around the clock. Scrap copper works differently. Old wiring and plumbing arrive as a mix of grades and purities, and yards discount the metal for the processing needed to refine it.
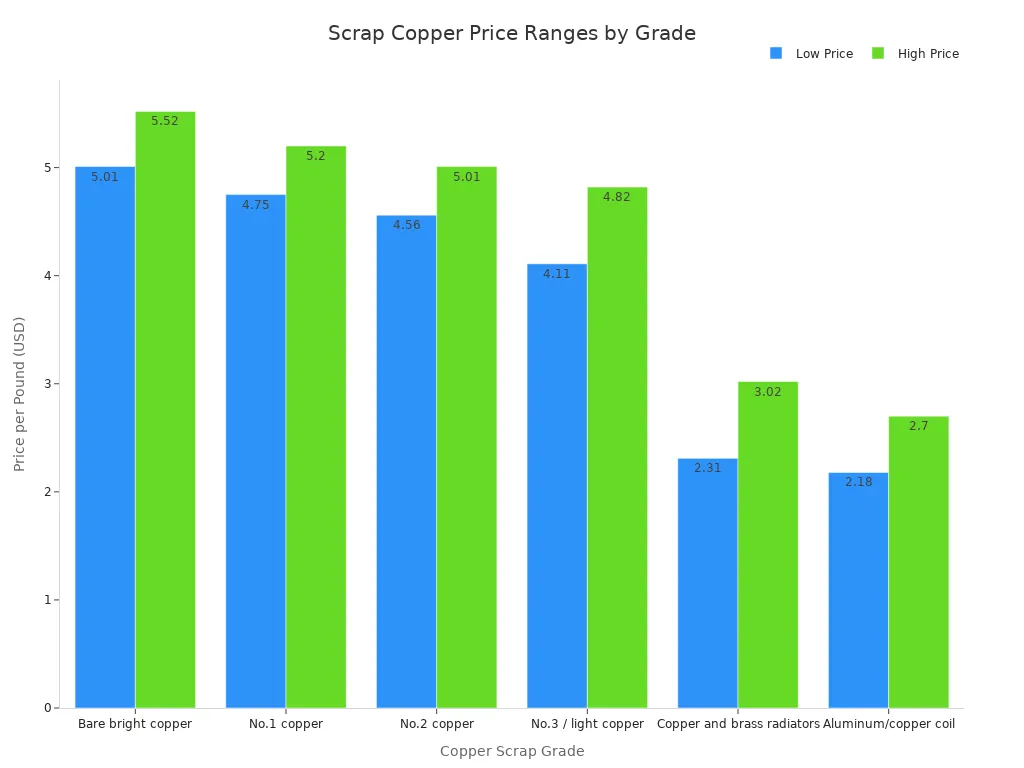
That gap shows up clearly in scrap copper prices. metalcharts.org reports bare bright wire at $5.01 to $5.52 per pound, clean No.1 pipe and solids at $4.75 to $5.20, and No.2 at $4.56 to $5.01. Lower grades fall further, with copper and brass radiators at $2.31 to $3.02. The chart below from metalcharts.org compares the full range across six grades.
Grade | Basis | Price per lb |
|---|---|---|
Bare bright copper wire (shiny stripped wire, 16 gauge or thicker) | 78% to 86% of COMEX copper | $5.01 to $5.52 |
No.1 copper (clean pipe, flashing, and solids; no solder) | 74% to 81% of COMEX copper | $4.75 to $5.20 |
No.2 copper (soldered pipe, bus bar, painted or oxidized) | 71% to 78% of COMEX copper | $4.56 to $5.01 |
No.3 / light copper (roofing and sheet with tar or heavy oxide) | 64% to 75% of COMEX copper | $4.11 to $4.82 |
Copper and brass radiators (auto and truck radiators, tanks on) | 36% to 47% of COMEX copper | $2.31 to $3.02 |
Aluminum/copper coil (ACR fin) (AC coils with the steel ends cut off) | 34% to 42% of COMEX copper | $2.18 to $2.70 |
Copper prices change every day because the copper market never closes. Economic data, mining news, currency shifts, and industrial demand all feed into the quote. A single report from a major producer can move the price of copper within hours.
Scrap prices fluctuate on the same rhythm. Yards reset their boards each morning against the prior day's close, so scrap copper prices rarely hold still for a week. Watch the spread between grades rather than one headline figure. That spread tells you more about market conditions than any single quote. Expect price fluctuations of a few cents per pound on quiet days and wider swings when news breaks. Track scrap prices across several sessions before you commit to a sale or a purchase. Market prices reward patience, and the copper price today will not match next week's board.
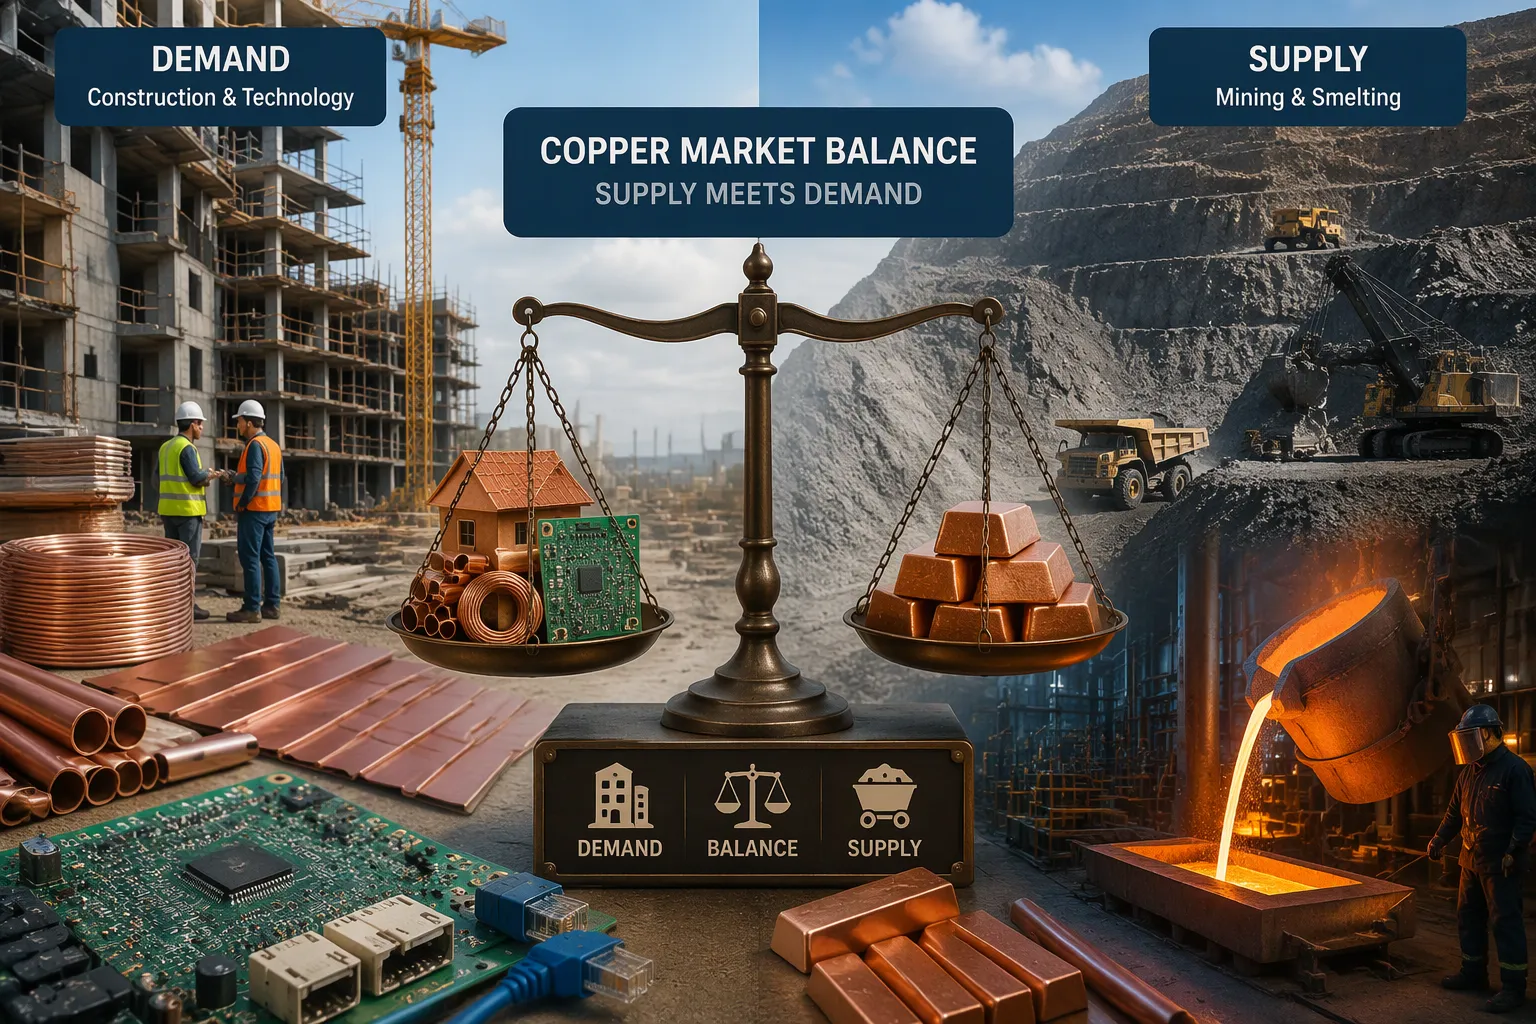
Supply and demand is the main force behind the copper price. When buyers want more metal than producers can supply, the price of copper goes up. When metal builds up and buyers hold back, prices drop. Almost every move in the copper market comes back to this balance.
Construction work drives a big share of copper demand. Builders use copper for wiring, plumbing, roofing, and heating systems in homes and office buildings. Technology and electronics manufacturing add more demand. Circuit boards, connectors, motors, and electrical goods all depend on the metal. Copper demand from these industries grows with the wider economy. A busy building season raises orders for wire and pipe. A drop in factory output lowers orders for parts. Both changes show up in the copper price within weeks.
The supply side begins underground. Mine production sets how much raw material reaches the market. Electramet reports that big copper mining projects often take ten to twenty years to go from discovery to production. Ore grades in many major producing regions are also dropping. Lower grades mean miners must move and process more rock to get the same copper, which raises operating costs.
Smelting and refining capacity then decide how much mined copper becomes usable metal. These stages cost a lot of money and energy, and capacity often becomes a bottleneck. Columbia University's Center on Global Energy Policy reports that about 80 percent of global copper mines produce concentrate that needs smelting. The United States runs only two active copper smelters, and both are over a century old. China holds about 50 percent of global smelter production, and 12 of the 20 largest smelters are there.
Treatment and refining charges show the strain. Columbia reports that smelters in China, Japan, and Europe accepted TC/RCs in the $20 range in 2025. The Antofagasta–Chinese smelter deal for 2026 settled at $0, the lowest rate ever reached in annual negotiations. Spot market TCs hit negative $90 per ton in March 2026. Wood Mackenzie explains the chain: "Supply constraints transmit into copper future prices through several mechanisms, concentrate tightness compresses smelter margins and reduces refined output, force majeure events remove tonnage with limited warning, and long development timelines mean the market cannot respond quickly to price signals."
Supply shocks hit fast. Kristech Wire notes that copper prices fell sharply in late 2019 and early 2020 as manufacturing and construction slowed during the pandemic. Copper production dropped, and stockpiles shrank. When industries recovered, buyers competed for the same limited material, and prices hit record highs. That episode shows how supply and demand can swing the market in both directions.
China sets the tone for the copper market. For the past 25 years, the country has driven global demand for copper, according to Gorozen. That role means China's buying choices carry extra weight on copper prices everywhere.
China's hunger for copper rests on several supports. Gorozen reports a 13% year-over-year jump in Chinese copper use in 2023, though growth slowed to just 3% through the first eight months of 2024. The country has entered what Gorozen calls an era of overconsumption.
Renewable energy buildout: China added 1,100 gigawatts of renewable power capacity from 2018 to 2024, which lifted copper demand by an estimated 15 million tonnes.
Electric vehicles: 22 million EVs added another 1.3 million tonnes of copper demand over the same period.
Construction and manufacturing: property and factory activity soak up large amounts of wire, pipe, and electrical goods.
You can see why a change in Chinese construction or factory output spreads through the price of copper within weeks.
Beijing's decisions move the market fast. The China Banking and Insurance Regulatory Commission laid out 16 steps to help the property sector, including new loan lines totaling $162 billion from leading banks, per Global X ETFs. Home prices leveled off in January after a 16-month decline. Manufacturing grew at its fastest rate since April 2012 in February PMI data.
Scrap rules matter too. In October 2024, China cut its scrap copper import categories from five to three, Oilprice reports. No.1 and No.2 copper scrap still need at least 97% copper content, and copper nodules need 98%. China's stop on US scrap imports and tax rebate changes tightened scrap supplies and raised demand for refined copper. Watch these policy signals closely. They often hint at the next move in prices.
Electric vehicles use much more copper than gasoline cars. VanEck reports that EVs usually need several times more copper for electric motors, inverters, wiring harnesses, and charging systems. Every charging station you build adds more of the metal to the total.
Power grids tell a similar story. Modern grids are growing larger and more connected. They must take in renewable energy, support local power sources, and carry rising electricity loads. Each upgrade adds transmission lines, substations, transformers, and grid-scale storage. VanEck notes that grid expansion should stay one of the biggest long-term drivers of copper demand.
Wind and solar installations depend on copper for wiring, transformers, and transmission links. Electrified systems simply need more copper per unit of energy delivered than ordinary options. That ratio matters more than the size of any single project.
The numbers show the scale. VanEck reports that copper demand should grow from 28 million metric tons per year in 2025 to 42 million metric tons by 2040. That gain equals 50% above current levels. You can see why green goals lift copper prices over time. Policy support for clean power turns into real orders for wire, cable, and motors. Those orders tighten the market and push the price higher when supply falls short.
Watch this trend alongside mine output. Strong demand means little without enough metal to meet it. The two forces together shape where prices head next.
Mine output seldom shows up on time. A strike, a drought, or lower ore grades can wipe out supply with almost no warning. Crux Investor reports a strike still going on at the Mantoverde mine, water shortages in the Atacama region, and falling grades at older mines. Chile produces about 24 percent of the world's mined copper, based on 2024 data, so problems there spread quickly.
Mine production disruptions | Exchange inventory signal |
|---|---|
Strike still going on at the Mantoverde mine | Combined LME and SHFE stocks leave almost no cushion against interruptions |
Water shortages in the Atacama region | Low exchange inventories make prices more sensitive to even small shocks |
Falling grades at older mines | Inventories used to absorb shocks; that cushion is now mostly gone |
Inventories show you how much spare metal the copper market has. Crux Investor notes that London Metal Exchange and Shanghai Futures Exchange stocks are still low. When stockpiles are thin, a small disruption can cause a big jump in copper prices. S&P Global expected an average of about $4.05 per pound for 2024, which is a helpful analyst benchmark next to today's higher quotes.
No single force sets the copper price. A copper supply deficit grows when mines fall short and demand stays strong. Chinese policy changes then affect how fast buyers take in the metal. Energy transition projects add steady copper demand on top of that base. Low inventories decide how hard each surprise hits.
Watch these signals together. Compare strike news and ore grades with exchange stock levels. Follow Chinese scrap rules and property lending. Keep an eye on grid and EV orders. HZTG supplies graded copper such as C11000, C10100, and C10200, plus precision strips, busbars, and foil, with MOQ from 200 kg. Treat copper supply, demand, and market conditions as one system, and you will read the next price move with more confidence.
You now understand what drives the copper price. Supply and demand set the base. China's buying power can shift it quickly. Energy transition projects add steady demand for the metal. Mine output and exchange inventories decide how hard each surprise hits. No single force controls the market alone. The copper price per pound shows all of them working together. Watch Chinese policy, mine news, and stockpile levels in the months ahead. Track copper prices over several sessions. That habit gives you a calmer read on where copper goes next.
No. The exchange quote covers refined metal only. Scrap grades trade at a discount. Bare bright wire runs $5.01 to $5.52 per pound, and lower grades fall to $2.18 to $2.70, per metalcharts.org. Your grade and form set the real rate.
Each buyer orders a different grade, volume, and delivery term. A mill buying refined cathode sees one number. A fabricator buying precision strip sees another. Treat every quote as a snapshot of your own deal terms, not a universal rate.
Supply and demand set the base. China's buying power shifts it fast, and energy transition projects add steady demand. Mine disruptions and thin exchange inventories decide how hard each surprise hits. S&P Global put the 2024 average near $4.05 per pound as a reference point.
Check across several sessions, not one morning. Yards reset scrap boards daily against the prior close. Watch the spread between grades. That spread reveals market conditions better than any single headline figure.


