
English 
T: +86-571-8663-6649
E: hzbjys@hzbjys.com
E: hzbjys@hzbjys.com
7/F, 1st Building Of ZhongHao WangJiang International Center, NO.332 East WangJiang Road, HangZhou, ZheJiang, China.
Views: 0 Author: Site Editor Publish Time: 2026-11-18 Origin: Site


Copper busbar size and current rating link through standard reference charts. This guide gives you the full chart: size, cross-sectional area, weight per meter, DC resistance, and current ratings for still air, free air, AC, DC, and 30°C, 50°C, and 65°C temperature rise. You also get clear steps for reading each row. Four adjustment factors decide whether a chart value fits your real setup: temperature rise, ambient temperature, still air versus free air, and AC skin effect. Check these before you finalize any copper busbar size. Buyers comparing top copper and aluminum busbar manufacturers should also confirm alloy grade, since corrosion resistance alloys and conductivity vary by supplier.
Begin with your load current, then find a chart row that meets or goes above it in the column that matches your installation.
Change the chart rating for temperature rise, ambient temperature, and AC skin effect so it matches your real conditions.
Use the still-air column for closed panels and the free-air column for open setups.
For AC loads, use the AC rating column. This is because skin effect lowers the effective cross-section.
Use the chart as a starting point. Check it with your own calculation for unusual enclosures or high ambient temperatures.
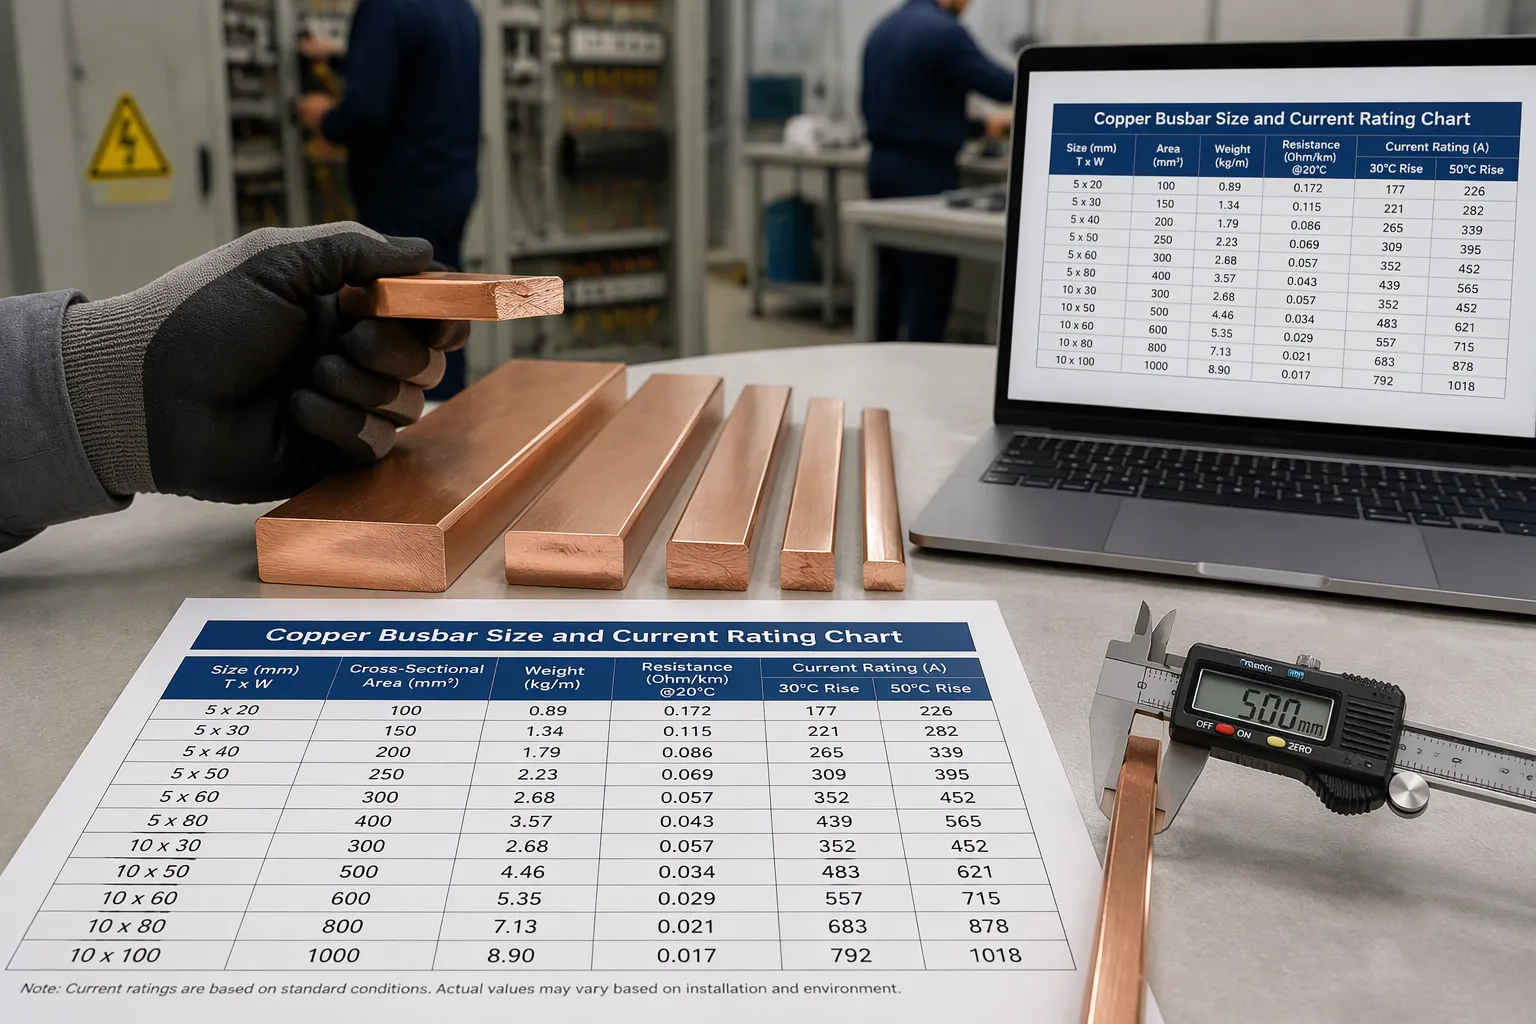
The master chart is the quickest tool for copper busbar size and current rating work. Each row pairs one bar size with its electrical and physical data. The table below shows what every column gives you, so you know what to check before you pick a size.
Column | What it tells you |
|---|---|
Busbar size (width x thickness) | The physical profile you order, usually in millimeters |
Cross-sectional area | Width times thickness; the basis for current density checks |
Weight per meter | Shipping, support spacing, and panel load planning |
DC resistance | Voltage drop and loss estimates at 20°C reference |
Still air rating | Capacity inside an enclosure with restricted airflow |
Free air rating | Capacity in open, unobstructed air |
AC rating | Capacity after skin effect reduces the useful section |
DC rating | Capacity for direct current, where the full section carries |
30°C, 50°C, 65°C rise columns | Capacity at each permissible self-heating limit |
Chart values usually assume copper alloy C11000 (ETP), the industry standard for busbars, with a minimum conductivity of 101% IACS. C10100, C12200, and C14500 are also common grades. Their conductivity differs a little, so confirm the grade behind any row you copy.
Start with the size column. It gives width and thickness, and the area column multiplies them. A 100 mm x 10 mm bar, for example, carries 1,000 mm² of cross-section. The weight column comes from area and copper density, and it matters for tray supports and shipping cost. DC resistance tells you how much voltage you lose per meter at a given current.
The rating columns split by two variables: airflow and current type. Still air means a closed panel. Free air means open mounting. AC and DC columns differ because alternating current does not use the full section. The three temperature columns let you match the bar to the heat rise your design allows.
Work backward from your load. Suppose your panel needs 1,000 A. Scan the still air column for a row at or above that value, because enclosed bars run hotter. Note the size, then confirm the area and weight fit your space and supports. Cross-check with the quick density rule: 1.2 A/mm² times area. A 1,000 mm² bar gives roughly 1,200 A by that estimate, so a chart row near 1,000 A in still air is plausible. The chart governs; the estimate only flags a mismatch.
Finally, check the temperature column against your design limit and the AC column if your load is alternating. This sequence keeps your copper busbar size and current rating choice grounded in the data rather than guesswork.
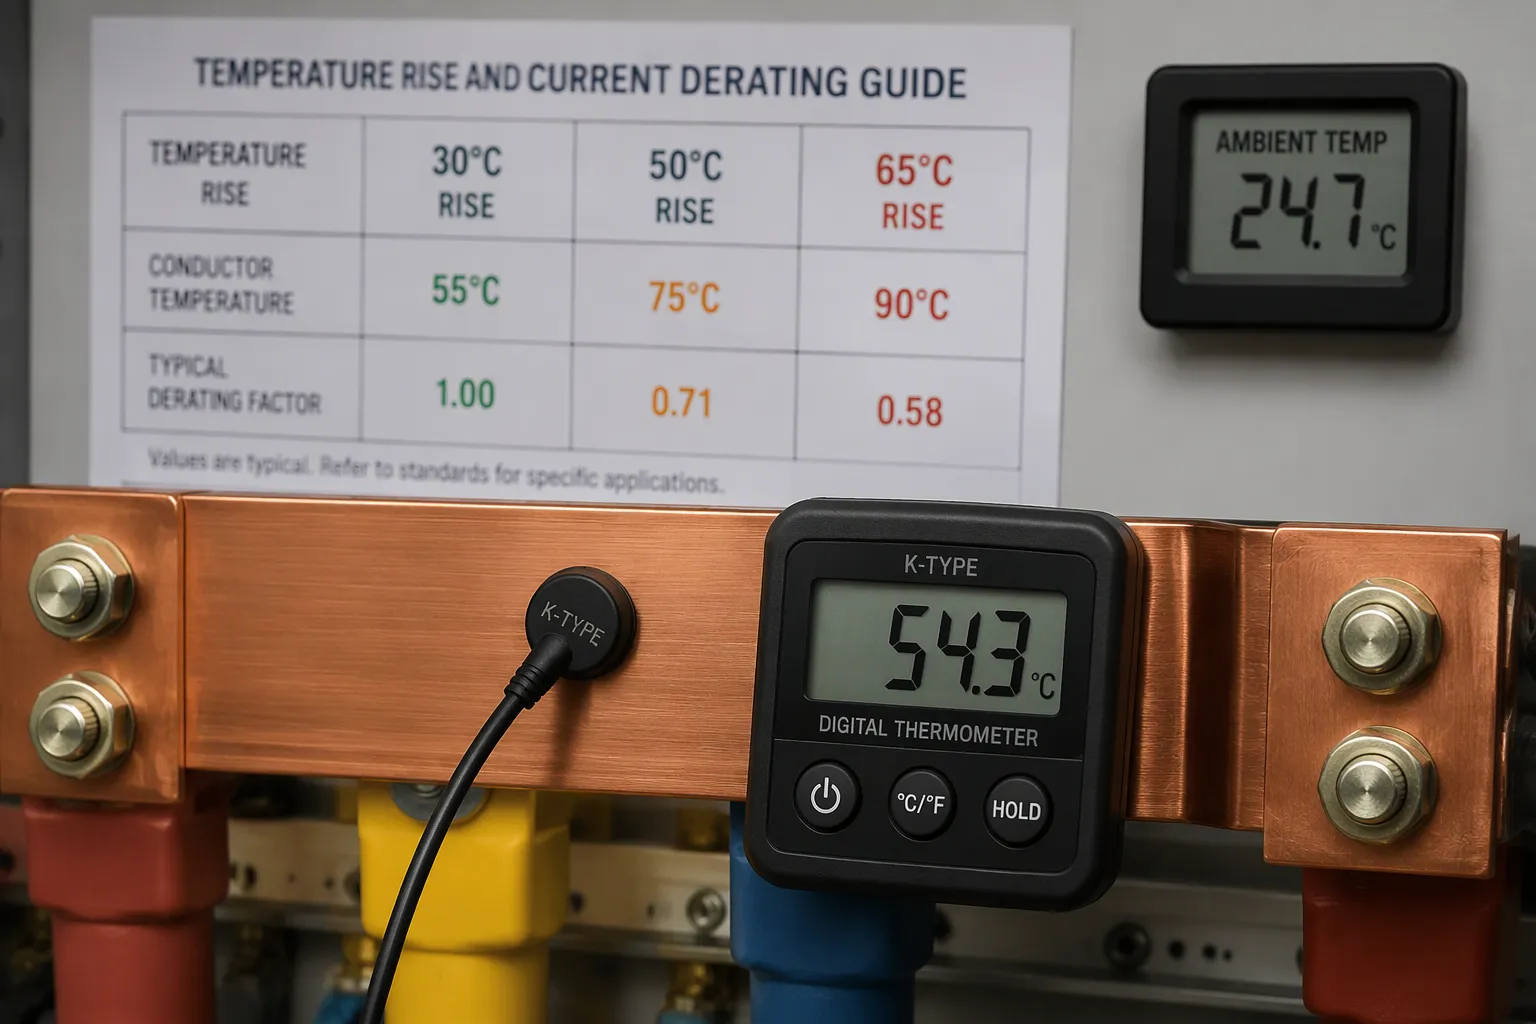
A busbar carries current and heats itself. The rating on any chart is not a fixed property of the metal. It is the current that produces a permissible self-heating rise above the surrounding air. This is why the same bar shows different numbers in different columns. Charts commonly list 30°C, 50°C, and 65°C rise columns, and each one answers a different design question.
Think of the rise as a budget. Your bar may warm up by 30°C above the room, or by 50°C, or by 65°C, depending on what the insulation, terminals, and enclosure can tolerate. A larger rise allows more current. A smaller rise allows less. The chart simply reports the current that spends the whole budget at steady state.
You can cross-check any row with a quick density estimate used in panel work:
Iccc = 1.2 × width × thickness, with width and thickness in millimeters and the result in amperes.
The 1.2 A/mm² figure is a typical current density for panels. A 100 mm x 10 mm bar gives 1.2 × 100 × 10 = 1,200 A by this estimate. Treat the result as a sanity check only. It ignores airflow, mounting, and alloy, so chart values govern your final copper busbar size and current rating decision.
Chart ratings assume a stated ambient air temperature around the bar. When your real ambient runs hotter, the bar starts closer to its limit. The permissible rise shrinks, and the safe current drops with it. A row rated for a 50°C rise in a 30°C room, for example, cannot deliver the same current in a 45°C room, because the absolute bar temperature would climb past the design limit.
Apply the correction in three steps. First, find the chart's assumed ambient, usually stated in the chart notes. Second, subtract your actual ambient from the maximum permissible bar temperature to get your real rise budget. Third, move to the chart column at or below that budget, or scale the current down until the rise fits. When your ambient sits between two columns, choose the lower-current column. The margin costs little copper and protects the insulation and joints.
Watch for heat sources inside the enclosure too. Transformers, drives, and other breakers raise the local air temperature well above the room reading. Measure or estimate that local value, not the room value, and derate against it. A bar that looks comfortable on paper can run hot when it shares a crowded panel with heat-generating equipment.
Airflow changes how fast a bar sheds heat, and that changes its copper busbar current rating. Two columns in the chart cover this variable: still air and free air. You must pick the column that matches your real installation, not the one that gives the bigger number.
Still air means the bar sits in a closed space with little or no moving air. A distribution panel, a switchgear cabinet, or a sealed junction box are typical still-air enclosures. Heat builds up inside these spaces, and the bar runs hotter for the same current.
Free air means the bar mounts in the open with unobstructed airflow around it. Open busway runs, rooftop racks, and exposed terminal bars in a ventilated room fit this case. Moving air carries heat away, so the bar stays cooler.
Still-air ratings are lower and free-air ratings are higher for the same bar size. The physics is simple. Trapped heat raises the bar temperature, and the permissible rise arrives sooner. Open air removes heat, and the bar can carry more current before it reaches the same limit.
Match the column to the enclosure, not to optimism. A bar inside a panel uses the still-air column, even if the panel has a few vents. A bar in an open rack uses the free-air column. When your setup sits between the two, choose the still-air value. That choice adds margin at little cost.
Also check the space around the bar. Bundled bars, nearby walls, and cable trays block airflow and push a free-air install toward still-air behavior. Treat any obstruction as a reason to derate. The chart gives you the two reference points; your enclosure decides which one applies.
Alternating current does not flow evenly through a copper busbar. The current pushes toward the outside of the bar and leaves the middle underused. This is called the skin effect. It makes the bar's resistance go up, so the same copper carries less current than it would with direct current.
The effect gets stronger as the busbar gets thicker and as frequency goes up. A thin bar hardly shows the effect. A thick bar at higher frequency loses a real share of its usable area. That is why a copper busbar AC rating is lower than its DC rating for large sizes.
A DC rating makes AC capacity look bigger than it is for large busbars. The DC column assumes the whole cross-section carries current. Alternating current uses mostly the outer layer, so the DC number is too high for AC service. Use the AC column when your load is alternating, or apply the chart's derating factor to the DC value.
Mounting position can matter too. A flat-mounted bar and an on-edge bar give off heat differently, and the on-edge position usually cools better. Check which mounting the chart assumes before you copy a value.
Take the 100 mm x 10 mm bar from earlier. Its DC rating looks fine for a given load. On AC at the same current, skin effect raises resistance and heat goes up. Move to the AC column, or derate the DC figure, and confirm the temperature rise still fits your budget. This step keeps your copper busbar size and current rating choice safe under real alternating load.
Every chart value depends on a set of test conditions. Your setup must match those conditions, or you will need to adjust the number. Check the base assumptions first before you trust a row for your copper busbar size and current rating decision.
The chart assumes a surface emissivity of 0.4. That number comes from samples left outside for 60 days in an industrial setting. So it reflects real copper that is slightly oxidized, not shiny lab samples. A freshly cleaned bar gives off heat differently. Check the ambient temperature stated in the chart notes, and also the mounting orientation, whether flat or on edge. Alloy conductivity is the fourth assumption, and it connects directly to the grade.
This is where material paperwork really helps. Hangzhou Target Import & Export Co., Ltd. supplies C11000, C10100, C12200, and C14500 copper bars, and each grade has slightly different conductivity. The company also gives mill test certificates with every batch. Compare the certificate to the grade behind your chart row. If they do not match, the rating needs fixing. The same supplier offers custom processing like CNC bending, punching, shearing, and tin-plating. So you can order a finished part that matches the chart profile instead of adapting a standard bar.
The chart covers common enclosures and normal airflow. Go beyond it when your setup falls outside those limits. Unusual enclosure shapes trap heat in ways the still-air column cannot capture. High ambient temperatures shrink the rise budget below the lowest chart column. Forced cooling, like fans or ventilation, pushes capacity above the free-air value. Nonstandard profiles, including extruded shapes or stacked bars, also need their own thermal analysis.
In these cases, work with a thermal engineer or the supplier's technical team. Bring your measured ambient, airflow data, and mounting details. A custom calculation costs little compared with a failed inspection or a hot joint. Treat the chart as your baseline, then check the final size against your real conditions.
Begin with the current you need. Choose the chart row that fits how your busbar is installed. Next, make the temperature-rise, ambient, and AC skin-effect adjustments. This order answers most copper busbar size and current rating questions.
Think of the chart as a starting point, not the final answer. Your real enclosure, airflow, and local code rules still affect the safe size. Check these before you place an order.
Keep the chart close by when you work in the field. Download the PDF version so you can look things up quickly during site checks and design reviews.
Start with your load current. Find the chart row at or above that value in the column matching your installation. Confirm the cross-sectional area and weight fit your space. Then check the temperature rise column against your design limit.
Use the still-air column. A closed panel restricts airflow, so heat builds up and the bar runs hotter. Still-air ratings are lower than free-air ratings for the same size. Choose still air whenever the bar sits in an enclosure.
No. Skin effect pushes alternating current toward the bar surface, so the middle carries less. This raises resistance and heat. Use the AC column for alternating loads, especially on thick bars. The DC rating overstates AC capacity for large sizes.
Multiply width by thickness in millimeters, then multiply by 1.2. The result estimates current capacity in amperes. A 100 mm x 10 mm bar gives about 1,200 A. Treat this as a quick cross-check only. Chart values govern your final copper busbar size and current rating.
Chart ratings assume a stated ambient. A hotter room leaves less room for self-heating before the bar hits its limit. Subtract your actual ambient from the maximum permissible bar temperature. Then pick the chart column at or below that remaining rise budget.


